How to evaluate a deep research agent, and why the eval deserves more time than the agent
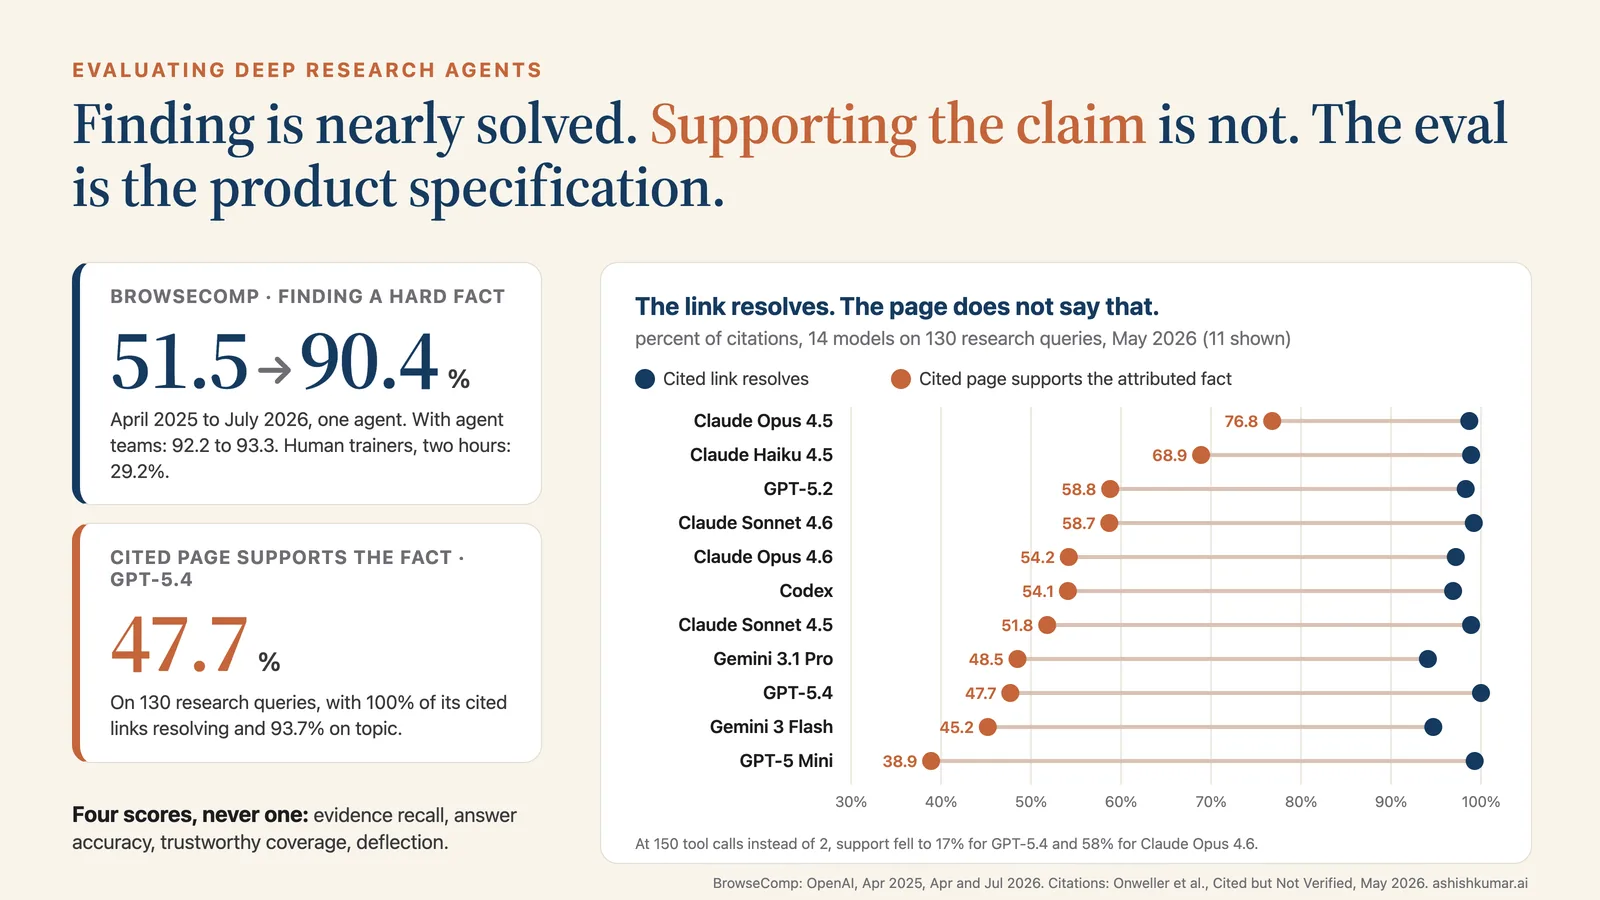
BrowseComp went from 51.5 to 90.4 percent for a single agent in fifteen months, and the labs say it is near saturation. In May 2026 a study of fourteen models found that for one frontier model every cited link resolved and the page supported the attributed fact 47.7 percent of the time, falling to 17 percent as the search budget grew. Evaluating a research agent is the evaluation stack of RAG and web search plus three problems of its own, and the eval is the specification. Here is how to build it, from more than forty papers.
On 9 July 2026 OpenAI released the GPT-5.6 family and reported 90.4 percent on BrowseComp for its flagship, Sol, running as a single agent, and 92.2 percent in a mode that coordinates four agents. A month earlier Anthropic’s system card for Claude Mythos 5 had reported 88.0 percent single-agent and 93.3 percent with a team of asynchronous sub-agents.
BrowseComp is OpenAI’s own benchmark for agents that hunt for hard-to-find facts on the open web. When it was published in April 2025, an early version of Deep Research scored 51.5 percent, GPT-4o with a browser scored 1.9 percent, and the human trainers who wrote the questions solved 29.2 percent of a sample within a two-hour limit. Fifteen months later, finding is close to solved on that test, and Anthropic’s April system card said as much: with its tools the benchmark “is close to saturation”.
In May 2026 six researchers at PwC published a different kind of measurement. They ran 130 research queries through fourteen models and checked every citation in every report three ways: does the link resolve, is the page on topic, and does the page support the specific fact attributed to it.
For GPT-5.4, every link resolved and 93.7 percent of the pages were on topic.
The page supported the fact 47.7 percent of the time.
When the tool-call budget rose from 2 to 150, the share of supported claims fell from 79 to 17 percent, while link validity and relevance stayed above 92 percent at every depth.
More reading produced more claims, and fewer of them were true to their sources.
Those two numbers, 90.4 and 47.7, are the subject of this essay. I have spent a good part of my career on evaluation: at Haptik I built the automated evaluation for intent recognition across twelve Indic languages, and at Active.Ai a machine comprehension system that reached ninth place on SQuAD 1.1, a reading test graded by matching a span of text. A model I published later, a query well-formedness classifier, is used to filter questions in Amazon’s GaRAGe grounding benchmark. Every one of those experiences taught the same thing: an evaluation is only as good as the thing it is cheap to check.
Deep research systems, which plan, search, read dozens of pages and write a cited report, have made the cheap check misleading. A short answer can be verified by a string comparison. A 3,000-word brief with forty citations cannot, and the failures that matter to an enterprise live in the brief.
The argument, in six lines.
Evaluating a research agent is at least four measurements: did it retrieve the evidence, did it reach the right answer, does each claim rest on a source that says so, and did it decline when the corpus had nothing.
Leaderboards measure the second. The product fails in the field on the first, third and fourth.
Those measurements are the evaluation stack of ordinary retrieval-augmented generation and of web search with a model on top. A research agent is the top tier of that stack and inherits every metric below it.
An enterprise agent fails along at least sixteen separable dimensions, most of which can be graded by code, and an eval that checks only the final answer cannot say which one broke.
In every lab that has published its method, the eval is the reward the agent was trained on and the specification the product was built to.
So the eval is not a test written after the agent. It deserves more design time than the agent does. The eighteen months of papers read for this essay show how to build one, what each choice costs, and what breaks when it is skipped.
Easy to verify, hard to find
BrowseComp is worth understanding in detail, because it set the pattern every lab now reports against, and because its own authors were precise about what it leaves out.
The questions were written by human trainers who started from a fact and wrote an “inverted question” around it: a description that is hard to find and easy to verify once you have the answer. Each question had to pass three checks.
GPT-4o, o1 and an early Deep Research could not solve it.
The trainer ran five simple Google searches and confirmed the answer was not on any first page.
For a portion of the set, a second trainer tried to solve it in ten minutes; trainers whose questions were cracked more than 40 percent of the time had to revise them.
After review, 21 of the original 1,287 questions were removed for bad or ambiguous answers, leaving 1,266. The paper carries a canary string so the set can be filtered from training data, and asks that examples never be posted in plain text.
The human baseline tells you what kind of task this is. Trainers attempted 1,255 questions without AI help, gave up on 888 of them after at least two hours, and solved 367. Of those, 317 matched the reference answer. The questions are not knowledge; they are persistence.
That is why a reasoning model without a browser, o1, scored 9.9 percent, and why Deep Research’s score climbed smoothly with the browsing effort it was allowed. Anthropic’s engineering team found the same thing in June 2025 while building their own research agent: on BrowseComp, the number of tokens an agent spent explained about 80 percent of the variance in its score, and tokens plus tool calls plus model choice explained 95 percent. A BrowseComp number without the budget behind it is a measurement of spend.
Three further results in the paper matter more to an evaluator than the headline.
Calibration. OpenAI asked each model for a confidence with each answer. Deep Research’s calibration error was 91 percent, the worst in the table, and giving GPT-4o a browser raised its calibration error from 69 to 82 while raising its accuracy by 1.3 points. Web tools make a model more confident, not more right.
Aggregation. Sampling 64 answers per question and keeping the one the model was most confident in improved accuracy by 15 to 25 percent, and best-of-N beat majority voting. The authors’ explanation is the one I opened with: the benchmark is easier to verify than to solve, so the model can often tell when it has the right answer even though its stated confidence is useless as a probability.
Training. A footnote on page six says the Deep Research model “is trained on data that specifically teach the model to be good at” these tasks. The benchmark was a training target before it was a test.
By April 2026 OpenAI’s launch table for GPT-5.5 listed BrowseComp at 90.1 percent for GPT-5.5 Pro, 85.9 for Gemini 3.1 Pro and 79.3 for Claude Opus 4.7, all at the highest reasoning setting. Anthropic’s April system card for Claude Mythos Preview reported 86.9 percent with web search, fetch, code execution and a three-million-token limit, and did something more useful: it estimated contamination. With no tools and no thinking the model still scored 24.0 percent, and 15.1 percent on short transcripts, which the card calls a better upper bound on memorisation.
By July the single-agent frontier was 90.4 and the multi-agent frontier 93.3. A benchmark on which humans score 29.2 percent, on which a fifth of the score may be memory, and on which the frontier is in the nineties, is near the end of its life as a discriminator. It remains the cheapest honest test of one capability, and a team can clone the method on its own corpus: write a hundred inverted questions whose answers sit in your documents, check that five searches do not surface them, and grade by exact match. That measures the needle.
What it does not measure, the paper says, is “a true user query distribution”: long answers, ambiguity, multimodal pages. Three later benchmarks show how different the picture is when those come back.
SealQA (Virginia Tech) keeps only questions on which search results conflict or mislead. On its hardest set, GPT-5 at its best reasoning effort reached 43.2 percent in April 2026, and giving DeepSeek-R1 search results lowered its accuracy from 22.4 to 11.0 percent. Search can make a model worse, and more reasoning effort did not reliably help.
WideSearch (ByteDance) asks for complete tables rather than single facts. The best configuration, o3 with multiple agents, succeeded on 5.1 percent of tasks in August 2025, while humans working alone managed 20 percent and near 100 percent with cross-validation, at 2.33 hours a task.
K-BrowseComp, a Korean-context version from June 2026, held GPT-5.5 to 45.7 percent and found that wrong attempts used more search calls than right ones, 9.3 against 7.1.
The needle test is necessary and nearly spent. The haystack report is where the work is.
Figure 1. Finding is nearly solved on the live web, and most of what remains is retrieval. Lab-reported BrowseComp scores rose from 51.5 to 90.4 percent for a single agent between April 2025 and July 2026, and to 93.3 with agent teams. On BrowseComp-Plus the same model moves from 14.6 to 93.5 percent depending only on what the search tool returns. Sources: OpenAI (April 2025, April and July 2026); Anthropic system cards (April and June 2026); Chen et al., BrowseComp-Plus (August 2025).
Three tiers, three evaluation stacks
Before the agent benchmarks, it helps to be precise about what is being evaluated, because “deep research” is the top of a stack with three tiers, and each tier has its own mature metrics that the tier above inherits.
Tier one is retrieval-augmented generation over a fixed corpus. One query, one retrieval, one answer, over documents you own.
The retrieval half has been measured the same way since Cranfield: Recall@k, the share of relevant documents in the top k; nDCG@k, which credits relevant documents more the higher they rank; and mean reciprocal rank, where the first relevant hit sits.
The unit matters. TREC’s 2019 deep learning track judged both documents and passages and transferred labels on the rule that a document with a relevant passage is a relevant document, which is why passage-level labels are the ones to collect: they are what a generator actually reads.
The generation half is newer and shakier. RAGAS, from 2023, decomposes an answer into statements and checks each against the retrieved context for faithfulness, and separately scores whether the answer addresses the question and whether the context was needed. On fifty questions its faithfulness metric agreed with two annotators 95 percent of the time, answer relevance 78 and context relevance 70.
Calibrate on your data. ARES, from Stanford, found that on Natural Questions the RAGAS context-relevance judge was right 31.4 percent of the time against 79.3 for a judge fine-tuned on synthetic data and checked with 150 to 300 human labels. Faithfulness checks against a given context are reliable; the rest need calibration.
The reference design is TREC’s RAG track, which began in 2024: a retrieval task, an augmented-generation task with retrieval held fixed, and a full-pipeline task, all over the same 113.5 million segments, graded by nuggets of required information and by whether each cited segment supports its sentence. In 2025 the best retrieval run reached nDCG@30 of 0.69 and Recall@100 of 0.23; the best full pipeline recovered 0.39 of the vital nuggets under strict grading; the best citation support was 0.84. Those are the ceilings over a clean corpus, with no agent in the loop.
Tier two is web-RAG: a model with a search tool, one or a few queries, answering from snippets or fetched pages. This is what “search mode” in a chat product is, and it has its own evaluation record, mostly bad.
The Tow Center at Columbia ran 1,600 queries through eight AI search engines in March 2025, pasting an excerpt and asking for the article, publisher, date and link: more than 60 percent of answers were wrong, Grok 3 was wrong 94 percent of the time, and ChatGPT never once declined.
The European Broadcasting Union’s study with the BBC across 22 public broadcasters, 18 countries and more than 3,000 responses in October 2025 found almost half of answers had at least one significant issue and about a third had serious sourcing problems.
Salesforce’s DeepTRACE measured citation accuracy for search engines at 68.3 percent for You.com, 65.8 for Bing, 49.0 for Perplexity and 39.8 for GPT-4.5.
FreshQA, Google’s 2023 benchmark of time-sensitive and false-premise questions, showed what the search tool is for: GPT-4 scored 28.6 percent under strict grading without retrieval and 75.6 with fresh search results in the prompt.
DeepResearch Bench’s “LLM with search tool” rows are the most instructive comparison in that paper: Claude 3.7 Sonnet with a plain search tool had the highest citation accuracy of any system, 93.68 percent, and GPT-4o with search 88.41, because a model that reads a handful of pages and cites them is doing an easier attribution job than one that reads a hundred.
Web-RAG inherits tier one’s metrics with two changes. The corpus is not yours, so freeze it or snapshot it. And the retrieval score becomes a property of the search provider, which Artificial Analysis now measures directly by holding the model fixed and swapping the search API, with results from 71 to 80 on its index against 33 for the model alone.
Tier three is the research agent: many queries, iterative reading, a long report. Google’s FRAMES benchmark from September 2024 is the bridge. Its 824 questions each need two to fifteen articles.
Gemini 1.5 Pro scored 0.41 with no retrieval, 0.47 with single-shot BM25, 0.73 with the right articles handed over, and 0.66 with a five-step iterative retrieval loop.
Iteration recovered most of the gap between one-shot retrieval and oracle evidence, and that gap is the entire reason research agents exist.
On BrowseComp-Plus the open agent trained for a single search makes 1.7 calls per query and scores 3.86 percent; the closed agents make 20 to 26 and score 50 to 70.
The agent tier therefore inherits everything below it, evidence recall and citation support from tier one, a frozen search layer from tier two, and adds three problems of its own: the budget, the orchestration, and the report. The rest of this essay is about those three, and about why the retrieval tier still sets the ceiling.
Figure 2. Three tiers, one stack. A research agent inherits every metric of retrieval-augmented generation and of web search with a model on top, then adds the budget, the orchestration and the report. Sources: TREC RAG track (2024, 2025); RAGAS (2023); FreshQA (2023); Tow Center (March 2025); Artificial Analysis Search Index (September 2026).
BrowseComp 51.5% to 90.4% in fifteen months; cited pages support the attributed fact 47.7% of the time, 17% at 150 tool calls
The retriever sets the ceiling
The first measurement is retrieval, and the reason to separate it is in the right half of Figure 1.
In August 2025 a team at the University of Waterloo published BrowseComp-Plus. They asked o3 to find the pages that support each BrowseComp answer, scraped them, and had fourteen student annotators spend over 400 hours verifying that the pages actually contained the clues, searching at least twenty minutes for missing evidence, and marking which pages held the answer itself. Then they mined hard negatives: GPT-4o split each question into about seven sub-queries, each sent to a search API for up to a hundred results.
The result is 830 verified queries over a fixed corpus of 100,195 documents, with an average of 6.1 evidence pages, 2.9 answer pages and 76 negatives per query. Every system searches the same haystack, and the retriever can be scored on its own with the Recall@k and nDCG measures that information-retrieval researchers have used since Cyril Cleverdon’s Cranfield experiments in the 1960s: a fixed collection, fixed queries, fixed relevance labels.
The findings reorder the usual argument about which model is best.
With BM25 keyword search, GPT-4.1 scored 14.58 percent. With a dense retriever, Qwen3-Embedding-8B, the same model scored 35.42 percent. Handed the human-verified evidence pages instead of a search tool, it scored 93.49 percent.
Qwen3-32B went from 3.49 to 10.36 to 83.25 on the same three conditions.
GPT-5 was the strongest agent, at 55.90 percent with BM25 and 70.12 with the embedder, and it got there with fewer searches, 21.7 per query against 23.2, because a better retriever shortens the hunt.
The retriever’s own numbers explain why: Recall@5 on evidence documents was 1.2 percent for BM25 and 14.5 for the embedder.
The paper also prices the runs. Over the 830 queries, o3 cost $836 with BM25 and $741 with the embedder; Opus 4 cost $2,044; Gemini 2.5 Flash cost $41.
In a deep research pipeline the model is the component you argue about, and the retriever is the component that sets the ceiling. That is the shape I described in Grounding is the product, now measured for agents that search twenty times rather than once.
A fixed corpus also lets you check attribution against labelled evidence, where the gap between models is wider than the gap in accuracy. With the embedding retriever, o3 cited the right documents with 91.8 percent precision and GPT-5 with 83.4; Claude Sonnet 4 managed 52.4 and Gemini 2.5 Flash 51.5. Same haystack, same evidence, very different honesty about which page said what, and invisible on BrowseComp, where only the final string is graded.
A follow-up from Edinburgh and Glasgow, published at SIGIR in June 2026, shows how much of the retriever’s contribution is engineering rather than model.
They split the same corpus into 2.77 million passages of at most 250 words and found that, for a 20-billion-parameter open agent, BM25 over passages reached 0.572 accuracy against 0.259 over whole documents, the best of any retriever in the study.
The reason was BM25’s length normalisation punishing long pages: indexing only the first 512 tokens of each document nearly doubled accuracy on its own.
Agents write queries in web-search syntax, quoted exact phrases and keyword strings, which favours lexical and sparse retrievers over the eight-billion-parameter dense models that dominate leaderboards.
A cheap re-ranker on top of BM25 reached 0.689, within two points of GPT-5 with the best embedder, while cutting search calls by 11 percent.
Re-running the original paper’s open baseline on a newer inference engine moved its accuracy from 0.346 to 0.421 with nothing else changed. Reproduce a published baseline before you trust your harness.
The same lesson now has an industrial form. In August 2026 Artificial Analysis launched a Search Index that holds the model fixed, GPT-5.6 Luna with a 25-turn budget, and swaps only the search provider. The model with no search scored 33; with providers it scored between 71 and 80, with search costs between $9 and $65 per thousand tasks. The search layer alone moved the score by forty points and the price by a factor of seven.
For enterprise retrieval the analogue is TREC’s RAG track, which since 2024 has run over a deduplicated MS MARCO corpus of 10.96 million documents cut into 113.5 million segments, with systems required to cite segment identifiers so that support can be checked. Its organisers’ automatic nugget evaluation, descended from the TREC question-answering track of 2003, agrees with human assessors at the level of ranking whole systems, a Kendall’s tau of 0.89 against edited nuggets, but only 0.33 to 0.52 per topic. And in 2025, when teams submitted their own automatic relevance labels, the best agreed with NIST’s assessors on 30 to 34 percent of judgments. Automatic judges can rank your pipelines. They cannot yet tell you which document failed.
The web moves under the test
Everything above assumed the haystack holds still. On the live web it does not, and the benchmark papers now record what that costs.
FutureSearch’s Deep Research Bench, published in May 2025 with 89 human-worked tasks in eight categories and since grown to 169, runs agents against RetroSearch, a frozen archive of scraped pages: a live search is issued, each result is looked up in the archive, unarchived results are dropped, and snippets are regenerated so the page looks like an ordinary result. Scores on the frozen web and the live web were close but not identical; o3 scored 0.51 live and 0.46 frozen, Gemini 2.5 Pro 0.45 and 0.46, so the order at the top flipped.
DeepResearchGym, from Carnegie Mellon, took the other route and built a free search API over a fixed 200-million-page ClueWeb snapshot; rankings of research agents were “largely consistent” with commercial search, with the caveat that about 18 percent of research queries are time-sensitive and a snapshot cannot serve them.
Drift is most damaging where it is least visible: in citation checking.
DeepResearch Bench’s citation metric, FACT, fetches every cited page and asks a judge whether it supports the sentence. When the FINDER team re-ran the same systems with stricter prompts in December 2025, Gemini Deep Research’s citation accuracy fell from 81.44 to 57.09 percent and its supported citations per task from 111 to 48, partly because publishers’ anti-scraping measures and dead links turned supported claims into unverifiable ones.
By June 2026 the AgentDisCo paper declined to report FACT on its own benchmark at all, because many referenced pages “become inaccessible (e.g., returning 404 errors)”.
A citation score that depends on today’s web is a different number next quarter, and the difference looks like regression.
There is a subtler drift too. OpenAI’s system card for Deep Research warns that a browsing agent can find rubrics, gold answers and answer keys posted online, so only evaluations that are entirely held out from the internet are guaranteed clean; its own PersonQA hallucination rate was overstated because the test set had gone stale and some “wrong” answers had become right. A research eval that lives on the web decays the moment it is published, in both directions.
The remedy is the one the retrieval community settled on sixty years ago: snapshot the corpus, store the fetched text beside every citation judgment, and re-run the live version periodically to measure the divergence rather than suffer it.
The report is where it fails
The third measurement is the one the product is sold on: the report. Here the benchmarks arrived in a cluster, each with a different grading design, and they agree with each other more than their authors expected.
DeepResearch Bench (University of Science and Technology of China, June 2025, later at ICLR 2026).
Started from 96,147 real queries to a search-enabled chatbot, filtered them to 44,019 that needed deep research, and had experts with doctorates or five years’ practice write 100 tasks in the same proportions across 22 fields, half in Chinese.
Its report score, RACE, is explicitly comparative: the judge scores the report and a reference report side by side on task-specific criteria, because the authors found that scoring reports in isolation “often yields insufficiently discriminative results”.
Its citation score, FACT, extracts every statement-and-URL pair, fetches the page and asks a judge for a binary verdict; that judge agreed with humans on 96 percent of supported pairs and 92 percent of unsupported ones in a 100-pair check.
Gemini 2.5 Pro Deep Research produced 111.21 supported citations per task at 81.44 percent accuracy; OpenAI Deep Research 40.79 at 77.96; Perplexity Deep Research 31.26 at 90.24; Claude 3.7 Sonnet with a plain search tool 32.48 at 93.68. Volume and precision pulled in opposite directions across the whole table.
Mind2Web 2 (Ohio State, June 2025).
130 long-horizon tasks, 57 of them with answers that change over time, each validated by at least two experts who completed the task themselves, in at least a thousand hours of labour including the judges.
The judge is the interesting part. Each task gets its own judge agent: a tree of binary checks averaging 34 leaves, in which an attribution node is critical, so a claim without a verifiable URL zeroes its branch.
OpenAI Deep Research, the best system, scored 0.54 partial completion against 0.79 for humans, in 8.4 minutes against 18.4.
The appendix defines a hallucination rate as the share of tasks with an invalid attribution (expired or fabricated URL) or an unsupported answer. OpenAI Deep Research’s rate was about 23 percent; every other system was at or above 50 percent; the human annotators fabricated no URLs at all.
ResearchRubrics (Scale AI, November 2025).
2,593 criteria for 101 prompts, between 20 and 43 per prompt, in over 2,800 hours, each scored satisfied, partly satisfied or not.
Gemini Deep Research reached 0.677, OpenAI Deep Research 0.664 and Perplexity 0.566.
Implicit requirements, the things an expert would expect without being asked, were 39.4 percent of all criteria, and implicit reasoning plus synthesis accounted for 45 to 50 percent of all failures; performance “degrades monotonically” as the logical nesting of a task deepens.
Report length correlated only weakly with score, r of 0.28 at best. Long is not the same as good.
DRACO (Perplexity with Harvard, February 2026) is the benchmark I would copy for an enterprise, because of how it was built.
Perplexity sampled a thousand of its own hardest Deep Research requests from September and October 2025, difficulty proxied by a thumbs-down, and stripped personal data with a model so that no raw query reached a human.
26 domain experts wrote rubrics, 45 to 60 minutes per draft, a second expert reviewing each.
Then came a saturation test: if Perplexity’s product already scored above 90 percent on a task, the task went back to the experts, which happened to about 45 percent of them.
The final 100 tasks carry 3,934 criteria, 415 of them negative, with penalties for harmful medical guidance reaching minus 500 against a maximum credit of plus 20.
The ordering of weaknesses was the same as everywhere else: the top system scored 90.3 on presentation, 67.9 on factual accuracy and 64.6 on citation quality.
It also recorded cost: Perplexity’s run took 245 seconds a task and OpenAI’s o3 configuration 1,808, emitting 24,944 output tokens a report.
Two more fill in the failure shape.
FINDER (December 2025) coded about a thousand reports into fourteen failure modes: strategic content fabrication was the largest at 18.95 percent of failures, insufficient information acquisition next at 16.30, and generation-stage failures together were 38.76 percent. The authors’ conclusion is that agents struggle “not with task comprehension but with evidence integration, verification, and reasoning-resilient planning”.
MiroEval (March 2026) graded the trajectory as well as the report and found that the weakest metric everywhere was traceability from report to process, whether what the report says can be found in what the agent did: the best system scored 63.3 and most scored under 55. For an auditor, that is the number.
Presentation quality
DRACO normalised score, February 2026
Perplexity DR (Opus 4.6)
90.3
Gemini Deep Research
87.1
Claude Opus 4.6
73.8
OpenAI DR (o3)
63.2
Factual accuracy
same benchmark, same systems
Perplexity DR (Opus 4.6)
67.9
Gemini Deep Research
54.9
Claude Opus 4.6
57.9
OpenAI DR (o3)
51.4
Citation quality
same benchmark, same systems
Perplexity DR (Opus 4.6)
64.6
Gemini Deep Research
51.5
Claude Opus 4.6
56.2
OpenAI DR (o3)
45.8
Figure 3. Reports read well before they are right. On DRACO’s 100 tasks and 3,934 expert criteria, every system scores highest on presentation and lowest on factual accuracy or citation quality; the gap between presentation and citation quality is 25 to 36 points. Source: Zhong et al., DRACO (February 2026), Table 13.
Claim by claim
The citation studies took the problem apart one sentence at a time, and they are the most important evidence in this essay because they measure the thing a reader will check.
The PwC study I opened with used a deterministic parser rather than a model to pair each sentence with its citation, fetched each page, and ran three binary judges. Its depth experiment is the result to keep.
At a budget of two tool calls, GPT-5.4’s cited pages supported 78.6 percent of the facts attributed to them; at ten calls, 45.9; at 150, 16.7.
Claude Opus 4.6 went from 80.0 to 57.9 over the same range.
The authors attribute the decline to attention dilution during synthesis: more retrieved passages raise the odds of conflating sources, and they suggest selective citation may beat exhaustive citation.
They also note the weakness of their own method: the judge was calibrated on “50 to 100” manual reviews with no agreement statistic published.
The Penn study. In April 2026 three researchers at the University of Pennsylvania checked 53,090 cited URLs from ten systems on one benchmark and 168,021 on another against the Wayback Machine, which lets you separate link rot from fabrication: a dead URL that was once archived existed; one that was never archived probably never did.
Deep research agents fabricated 10.7 percent of their URLs against 4.8 percent for search-augmented chat models.
Gemini 2.5 Pro Deep Research, citing 113 URLs per query, fabricated 13.3 percent.
OpenAI’s four search-augmented models had zero stale links: every dead citation was invented.
Rates doubled across domains, from 5.4 percent in business to 11.4 in theology, and Claude Sonnet 4.5 reached 17.4 percent in healthcare.
Their fix was an 83-line URL checker exposed to the model as a tool; three frontier models cut their non-resolving citations by between 6 and 79 times, to under 1 percent, while a small model called the tool and ignored its verdicts for fourteen rounds.
Figure 4. Dead links are two different failures. Checking against the Wayback Machine splits non-resolving citations into fabricated (never existed) and stale (link rot). Deep research agents fabricate at twice the rate of search-augmented chat models, and the OpenAI search models’ dead links were all fabrications. Source: Rao, Wong and Callison-Burch (April 2026), Table 2.
The localisation study. In August 2026 Hirsch and colleagues, accepted at EMNLP, went inside multi-agent research systems and tested each agent against its own inputs rather than against the final page, with a human check at a kappa of 0.62.
In NVIDIA’s AI-Q system, the researcher sub-agent had a local error rate of 70.8 percent and the orchestrator 30.9.
Yet 84.7 percent of the errors that reached the final report originated at the orchestrator, because its errors were citation losses on claims that survived while the researcher’s hallucinations were filtered out.
Two one-line interventions, passing raw snippets instead of intermediate notes and forbidding the orchestrator to use uncited material, each raised citation recall by five points.
The error is introduced where the pieces are joined, and you cannot see it without logging what each hop was shown.
The pattern predates the agents.
Salesforce’s DeepTRACE, at ICLR 2026, scored 303 queries across nine systems and found unsupported statements running at 12.5 percent for GPT-5 Deep Research and 97.5 percent for Perplexity Deep Research.
The Tow Center at Columbia ran 1,600 queries through eight AI search engines in March 2025 and found more than 60 percent of answers wrong about the article they were quoting, with Grok 3 wrong 94 percent of the time and ChatGPT never once declining.
A 2026 study of a four-billion-parameter research agent running on a laptop found a trade-off that any support metric must respect: letting the model see more of each source raised faithfulness from 0.45 to 0.58, while the “repair” strategies that pushed faithfulness to 0.69 did so by cutting citation recall to 0.27. A support rate alone rewards saying less. The number to report is trustworthy coverage, support multiplied by recall.
If this sounds like a problem for machines, the human record says otherwise. GPTZero scanned 300 ICLR 2026 submissions in December 2025 and found 50 with at least one fabricated citation that three to five reviewers had missed; its NeurIPS 2025 scan confirmed 100 fabricated citations across 53 accepted papers, 66 percent of them invented wholesale. The reader who checks one claim and finds the page does not say it is the reader who stops trusting the rest, and the research agent that invites that reader is the one that cites most.
Cited links that resolve
percent of citations, 130 queries, May 2026
GPT-5.4
100
Claude Sonnet 4.6
99.2
Claude Opus 4.5
98.7
Gemini 3.1 Pro
94.1
Cited page supports the fact
percent of citations, same study
GPT-5.4
47.7
Claude Sonnet 4.6
58.7
Claude Opus 4.5
76.8
Gemini 3.1 Pro
48.5
GPT-5.4 support by tool-call budget
percent of cited facts supported
2 calls
78.6
10 calls
45.9
50 calls
38.0
150 calls
16.7
Figure 5. Links resolve; claims do not. In the PwC study of May 2026 every frontier model’s citations resolved at least 94 percent of the time, but the cited page supported the attributed fact between 47.7 and 76.8 percent of the time, and for GPT-5.4 the support rate fell from 78.6 to 16.7 percent as the tool-call budget rose from 2 to 150 (Claude Opus 4.6: 80.0 to 57.9). Source: Onweller et al., Cited but Not Verified, arXiv 2605.06635.
Grade the grader before it grades anything
Every report benchmark above uses a model as judge, and the agreement figures they publish are the most useful numbers in the papers, because they tell you which kinds of judgment a model can be trusted with. Put together, they say one thing. Judges are reliable on small binary questions with the evidence in front of them, and unreliable on holistic grades, partial credit and anything long.
On the reliable side:
Mind2Web 2 had a human re-check 720 of its judge’s leaf verifications; of 35 disagreements, 27 were the human’s mistakes, and after adjudication the judge was wrong seven times, a correctness of 99.03 percent.
DeepResearch Bench’s support judge hit 96 and 92 percent on the two verdict types.
The original RAGAS paper found its faithfulness metric agreed with annotators 95 percent of the time on fifty questions.
TREC’s automatic nugget evaluation ranks systems with a Kendall’s tau of 0.89 against human-edited nuggets.
On the unreliable side:
DeepResearch Bench’s holistic report judge agreed with experts in 71.33 percent of pairwise comparisons, a little above the 68.44 percent that the experts agreed with each other, and the paper’s ablation shows that taking away the reference report drops agreement by five points and a plain prompt drops it to 58.89.
TREC’s human-versus-GPT-4o check on whether a cited passage supports a sentence matched exactly only 56 percent of the time when humans graded from scratch.
LongJudgeBench, from June 2026, tested 32 judge configurations on 1,944 pairs of long outputs averaging 9,250 tokens, including deep research reports: mean pairwise accuracy was 0.563 where chance is 0.5, the best judge reached 0.672, and one judge gave 9.26 out of 10 to a twelve-thousand-token answer that human experts scored 5.87 because it had buried the question.
ResearchRubrics measured its judges against nine annotators on 303 responses: macro F1 of 0.72 to 0.76 when each criterion was pass or fail, 0.53 to 0.57 when the judge could award partial credit.
ResearchRubrics’ ablations are the practical guide.
Adding a brief concrete example to a criterion raised agreement by three to four points.
Having a model expand or reword the human-written criteria cut agreement by 15 to 20 points, from 0.760 to 0.564 in the worst case. Rubrics are not a place to save labour with generation.
DEER, from LG, found the same from the other side: giving the judge expert-written guidance specific to the task lifted its correlation with experts from 0.63 to 0.73, while merely adding more scoring dimensions pushed cross-judge agreement down.
DRACO found that three different judge models ranked systems in the same order but gave one system 70.5, 50.4 and 75.5, so absolute scores are never comparable across judges or benchmarks.
The June 2026 Berkeley study I covered in The evaluation bench, in full remains the warning label: raw agreement overstates chance-corrected agreement by 34 to 41 points, and a judge can reproduce its own verdicts almost perfectly while being wrong.
Anthropic’s January 2026 guide to agent evaluation folds this into practice: one isolated judge per rubric dimension rather than one judge for everything; an explicit “Unknown” escape so the judge does not hallucinate a grade; grade outcomes rather than paths; start with 20 to 50 tasks drawn from real failures; and read the transcripts, because a 0 percent pass rate is most often a broken task. Their example is instructive: Claude Opus 4.5 went from 42 to 95 percent on a public benchmark after fixing grading bugs, one of which rejected “96.12” against a reference of “96.124991”. A grader is code. It has bugs.
There is a sharper reason to grade the grader, which I wrote about in Cheating on the test: any judge used as a reward becomes the attack surface. The 2026 evidence is now specific.
Scale AI trained models against rubric verifiers of two strengths and tracked, with a reference panel, how often the verifier gave credit the panel unanimously rejected: with the weak verifier that rate rose from 39 to 65 percent during training, and the proxy score peaked at step 200 and then fell while the policy kept optimising.
Responses grew longer and denser with claims, and more of the claims were wrong; rubric-based judges preferred the trained model on 85.8 percent of prompts while judges without the rubric preferred the untrained one on 78.4.
Presence-based criteria, “mentions X”, carried 90.2 percent of the rubric weight, and the mitigations that worked were negative criteria, stronger held-out verifiers and stopping early.
A Meta study training scientific-planning agents by self-grading found the self-assigned score kept rising after roughly step 120 while agreement with a held-out grader fell, and plans grew “superfluous details”.
One search-agent training recipe caps the number of cited URLs at twenty explicitly “to prevent the agent from hacking the reward” by citing everything.
A survey of reinforcement learning for research systems states the general rule: dense process rewards “can trigger reward hacking or tool avoidance”.
Hold out the judge, rotate the rubric wording, weight absence as well as presence, and sample for human review.
Figure 6. Decompose before you judge. Model judges reach 95 to 99 percent agreement with humans on binary checks against evidence and rank whole systems well, but fall to near chance on holistic grades of long reports and to a third on per-item relevance labels. Sources: Gou et al. (2025), Du et al. (2025), Es et al. (2023), Pradeep et al. (2025), Sharma et al. (2025), Thakur et al. (2025), Chen et al. LongJudgeBench (2026), Upadhyay et al. (2026).
Grade the process, the budget and the noise
Outcome scores miss two things an enterprise has to know: how the agent got there, and whether the number would come out the same tomorrow.
The process.
FutureSearch tried fifteen trace-level checks and found only three reliable enough to report, and only when run as one judge call per step rather than an open-ended “list any issues” prompt, which had a high false-positive rate and a low true-positive rate.
Of the three, forgetting information already retrieved was the only significant predictor of a low score; hallucination was borderline, and repeated tool calls did not predict anything. Thinking models got stuck repeating tools; non-thinking models forgot more.
Runtime did not predict score either: “Longer runtime was not generally associated with a higher score.”
MiroEval’s process score correlated 0.88 with outcomes, which argues that the trace is worth grading, and its traceability metric, whether the report’s claims appear in the trace, is the one an auditor will ask for.
The budget is a dial to evaluate, not a feature to ship. The depth curve in Figure 5 is the research-agent version of a general result.
A study of 10,664 agent trajectories across nine models in August 2026 found success decaying geometrically with the number of dependent steps, collapsing to near zero within sixteen steps on a tool-use task, and found that step count, not context length, drove the decay.
On a customs-classification task, a search agent scored 40.8 percent with reasoning before tool calls switched off and 35.4 with it switched on.
On BrowseComp-Plus a better retriever raised GPT-5 by fourteen points while cutting search calls.
In multi-agent research the failure is social rather than individual: Snowflake’s ArcticSwarm paper in September 2026 found GPT-5 scoring 27.4 percent on tasks where no alternative candidate answer had been explored and 78.5 where at least one had, that about half of all failures had already retrieved the correct answer somewhere in the swarm, and that majority voting over forty independent runs topped out at 63.5 percent against 82.6 for a design that kept agents isolated until review gates. Count the hypotheses explored and the verification gates passed, not the agreement.
The noise. The arithmetic is unforgiving and mostly ignored.
Evan Miller’s statistical guide for Anthropic in November 2024 worked the standard power calculation: to detect a three-point difference between two systems with 80 percent power you need about 969 independent questions, which is why he recommends new evals carry at least a thousand. Clustered standard errors, when questions come in groups, can be three times the naive ones.
A KTH study at ICLR 2026 ran 60,000 agent trajectories and found that a single run’s score varies by two to six points depending on which run you happened to observe, with a standard deviation of one to 1.8 points even at temperature zero; detecting a two-point gain needs about nine runs per agent, a one-point gain 36.
A December 2025 study using intraclass correlation found agent evals stabilise after 8 to 16 trials per task for structured work and 32 or more for complex reasoning.
Set that against FutureSearch’s leaderboard, where the top four systems sit within 1.3 points with no error bars, or any 100-task benchmark run once.
Paired differences on the same questions, multiple runs, and a pass^k figure for consistency (at 75 percent per run, three in a row is about 42 percent) are the minimum. And cost belongs in the same table: FutureSearch prices Claude Opus 4.6 at $0.53 a task on high effort for 0.553 and $0.24 on low for 0.514; LangChain’s open agent cost between $46 and $187 to run a hundred tasks depending on the model; Anthropic reports multi-agent systems using fifteen times the tokens of chat.
Benchmark
What it grades
Unit of grading
Grader and its validation
Web drift control
BrowseComp OpenAI · April 2025
Finding a hard-to-locate fact
1,266 short answers
Model match against a reference string; humans 29.2% in 2 h
None; live web; canary string
BrowseComp-Plus Waterloo · August 2025
Finding, evidence recall, citation precision
830 answers, 6.1 evidence pages each
Exact match; Recall@k on labelled evidence; 400+ annotator hours
Fixed corpus of 100,195 pages
TREC RAG track NIST and Waterloo · 2024 and 2025
Retrieval, augmented generation and full RAG over one corpus
301 topics (2024), 105 narratives (2025)
Nugget recall and citation support; run-level τ 0.89 vs edited nuggets, 0.33 to 0.52 per topic
Fixed corpus of 113.5 million segments
FRAMES Google · September 2024
Multi-hop answers needing 2 to 15 articles
824 questions
Answer accuracy; oracle 0.73 vs one-shot 0.47 vs iterative 0.66
Fixed article set
SealQA Virginia Tech · June 2025
Answering when search results conflict or mislead
111 hardest questions
Auto-rater with “not attempted” label; humans 38.8% on a 50-question subset
None; live web
Deep Research Bench FutureSearch · May 2025
Multi-step research with human-worked answers; trace checks
89 tasks at launch, 169 now
Per-task scoring; three per-step trace checks with o3
RetroSearch frozen archive
DeepResearch Bench USTC · June 2025
Report quality vs a reference (RACE); citation support (FACT)
100 tasks, 22 fields
Gemini judges; 71.33% pairwise vs experts (experts 68.44%); 225 person-hours
None; pages fetched live
Mind2Web 2 Ohio State · June 2025
Answer correctness and source attribution
130 tasks, tree of binary checks
Judge agent per task; 99.03% on 720 re-checked leaves
None; 57 tasks time-varying by design
LiveDRBench Microsoft · August 2025
Recall and precision of key claims, not prose
100 tasks, 8 categories
GPT-4o claim matching; best F1 0.555
None
ResearchRubrics Scale AI · November 2025
Rubric compliance of the report
101 prompts, 2,593 criteria
LLM judge; macro F1 0.72 to 0.76 binary, 0.53 to 0.57 ternary; 2,800+ hours
None
DRACO Perplexity · February 2026
Accuracy, depth, presentation, citation quality
100 tasks, 3,934 criteria, 415 negative
Gemini-3-Pro judge; rankings stable across three judges; no human agreement published
None
MiroEval MiroMind · March 2026
Report, factuality and the trajectory
100 tasks, 30 multimodal
Three judges; process score correlates 0.88 with outcome; expert ranking τ 0.91
None
Cited but Not Verified PwC · May 2026
Whether each citation resolves, is relevant, supports the fact
130 queries, 14 models, per citation
HTTP check plus binary judges calibrated on 50 to 100 reviews
None; liveness recorded
GaRAGe Amazon · June 2025
Grounding on relevant passages; deflection when none exist
Table 1. Fourteen evaluations across the three tiers, retrieval, web-RAG and research agents, by what they grade and how the grader was checked. The ones that grade binary checks against evidence report the highest agreement with humans; the ones that fetch the live web cannot be re-run. Sources: the papers cited in the text.
What the enterprise adds
An internal research agent sits on a corpus the public benchmarks never see, and four failure modes arrive with it.
Deflection. Amazon’s GaRAGe benchmark (Findings of ACL 2025), with 2,366 questions over private and web sources, measured whether a model grounds its answer in passages labelled relevant rather than in whatever was retrieved, and whether it declines on the 427 questions where no relevant evidence exists. The best model grounded 60.67 percent of answers correctly and deflected on 31.1 percent of the questions it should have. Meta’s AbstentionBench, across twenty datasets, put the best abstention recall at 0.71 and found that reasoning fine-tuning lowers it by about 24 percent on average; more thinking makes a model less willing to say the corpus has nothing. An agent that never says so is the single most dangerous one a company can deploy, and no standard RAG metric catches it. Give the eval a slice of questions whose correct answer is “not in the corpus”, and a slice whose correct answer is “not permitted”, for which the only published evaluation I could find is 389 synthetic queries.
Versions and duplicates. A 2025 benchmark of questions over 34 versioned technical documents put naive RAG at 58 percent and a version-aware design at 90. A 2026 ACL paper found a strong retriever falling from 66.4 percent on general-knowledge questions to between 5.0 and 27.9 percent on finance, legal and patent corpora, because redundancy breaks the assumption that there is one correct document. An enterprise benchmark released in May 2026 seeds its 500,000-document synthetic corpus with misfiled documents, near-duplicates and conflicting facts for exactly this reason.
Ingestion. OHR-Bench measured the best OCR pipeline against clean text over 8,561 PDF pages: retrieval fell 10.8 points and the end-to-end score about 14 percent. Parsing errors are retrieval errors, and for Indic-language documents, where benchmark coverage is thin, the 30-day plan I wrote in September applies to the parser before the model.
The vendors publish almost nothing. Glean’s February 2026 comparison was 280 of its own queries graded by four of its own people; Microsoft’s Researcher claims a gain on DRACO, a public web benchmark written by a competitor; Google and Perplexity publish no accuracy figures for their internal-corpus products at all. Glean’s own engineers wrote that “there are no good public benchmarks” for this. They are right, which means the benchmark has to be yours.
How extensive the eval has to be: the full dimension list
Everything above measures a research agent on four scores, and four is the minimum, not the design. I have spent the past weeks drafting a benchmark for a numbers-heavy domain of my own, and the exercise taught me three things: an enterprise agent fails along at least sixteen separable dimensions; most of them can be graded by code rather than by a model; and an eval which checks only the final answer cannot tell you which of the sixteen broke.
Here is the inventory I now insist on, with the grading method for each. It applies to any agent whose job is to answer from documents that change: regulatory filings, supplier records, product specifications, financial statements, internal policies.
Is the value right, including its unit, scale and period? Accuracy, graded by code against a tolerance set per item, after normalising number formats, currencies and scale words. A thousand-fold error in lakh and crore or million and billion is the most common wrong answer in Indian data, and a tolerance check catches none of it unless the normaliser runs first.
Is it the latest figure, or a superseded one? Staleness, graded by code. This needs the gold answer to be bitemporal: every item stores the value, the period it describes, the date it was published and every previous value it replaced, so that an agent quoting last quarter’s revision is scored as stale rather than merely wrong. Staleness and accuracy move independently, and a model that memorised a figure in training will quote it confidently long after the publisher revised it. A separate check, with and without today’s date in the prompt, measures how much the agent depends on being told what day it is.
Does it know which version it is quoting? Vintage awareness. Official statistics have first, revised and final estimates, and series are rebased; a correct number for the wrong vintage, or a growth rate computed across two bases, is a distinct error with its own label. The grader requires the qualifier, not just the number.
Can it reason in time? Point-in-time questions (what was known on a given date), event dates, effective dates that differ from announcement dates, and release calendars (has this been published yet?). Graded by code against dates.
Did it reach the canonical source? Authority, decided per dataset and not per website: the body that compiles a series is canonical for that series, an official re-publisher scores lower and may be stale, an aggregator or exam-preparation site scores zero however often it is right. This is the dimension the retrieval tier measures with evidence recall and the search tier with provider swaps; here it becomes a weighted score on the best supporting citation.
Does each citation exist, resolve and support the claim, with a locator? The claim-by-claim checks above, plus locator precision for long documents: a citation to a 400-page report without a page or table reference is not a citation an auditor can use. Fabrication is its own count.
Can it read the document? Extraction from PDFs with merged headers, scanned pages, charts, spreadsheets and dashboards, graded by giving the agent the gold document directly so that reading is isolated from finding. OHR-Bench’s 14 percent end-to-end loss from OCR alone is the reason this is its own dimension.
Can it build a dataset? Cell-level F1 and row coverage on tables the agent is asked to compile, with a citation per cell. Silent missing rows, thirty of thirty-three months returned, are the characteristic failure, and WideSearch’s 5 percent success rate on complete tables says no current agent does this well.
Can it compute? Growth rates, compound rates, percentage points against percent, currency and scale conversions, graded by code with the working required. A correct figure derived across mismatched denominators is wrong, and the trace shows whether the arithmetic was done or guessed.
Can it reason over a series and across sources? Trends, streaks, records, rankings and joins between datasets with aligned periods, graded by code against ordered lists and booleans.
Does it abstain correctly? Calibration: declining when the data does not exist or has not been released, and correcting a false premise, graded against paired answerable controls so that over-refusal is measured on the same footing as hallucination. GaRAGe’s 31 percent deflection rate and AbstentionBench’s finding that reasoning training lowers abstention by a quarter make this the dimension most likely to be silently bad.
Can it judge between sources? Two official bodies legitimately disagreeing, a secondary source misreporting a primary, a projection presented as an outcome, a private series presented as official. Graded as a verdict plus the corrected figure, with claims generated by mutating verified facts in known ways so the grader knows exactly which mutation it is testing.
Does it resist injected content? Instructions planted in a fetched document, a doctored copy of a release served beside the genuine one, a fake circular that has already been debunked. Graded as resisted, partly affected or compromised, in a sandbox, never on the open web.
Can it synthesise and hold a conversation? The rubric-graded brief and the multi-turn session with ellipsis and context carry-over, scored per turn and per session, where a model judge is unavoidable and must be a calibrated ensemble.
Is it consistent? Paraphrase sets with identical normalised answers, run-to-run agreement on repeated runs, and the gap between prompts with and without the date.
What does it cost? Latency at the median and the 95th percentile, cost per correct answer rather than per query, and the tool-call budget actually used.
Four design choices make a list this long workable.
Grade deterministically wherever the answer is a number, a date, a category, a list or a verdict, and publish the share of items graded by code. The target should be well above three-quarters, which leaves the model judge for synthesis alone.
Give every item near-miss gold answers: the superseded value, the adjacent period, the wrong series, the ten-times scale error. A wrong answer is then labelled by what it is rather than merely counted, and the error distribution becomes the diagnostic.
Tag every item with every complexity it carries, from an implicit vintage to a renamed series to a bot-protected canonical file, and report accuracy against the number of stacked tags. Real questions stack them, and a single average hides the cliff.
Run the same agent in diagnostic settings. Closed-book against open-web isolates what retrieval adds; oracle-document against open-web isolates what finding loses; and the share of stale answers whose trace contains the correct current value measures the model trusting its memory over what it fetched.
The answer key needs the same rigour as the agent.
Extract each gold value three times, by independent agents from different model families using different access paths, with none seeing the expected value.
Run deterministic checks that the quote appears verbatim in the snapshot and that components sum to totals.
Set adversarial verifiers loose on it: one hunting for later revisions, one for alternative readings of the question, one for whether the source is canonical.
Certify only on consensus.
Have a domain expert sign off, with their overturn rate on certified items published as the residual error estimate.
Plant about five percent known-bad gold answers into every batch and require the pipeline to catch nearly all of them before it is trusted.
BrowseComp removed 21 of 1,287 questions after review and BrowseComp-Plus dropped 175 more; an answer key built by one pass of one model family will inherit that family’s blind spots and then rank it.
Figure 7. The answer key is built like a system under test. Blind multi-family extraction, deterministic checks, adversarial verification, consensus and expert sign-off, with planted errors to measure the pipeline’s own catch rate. The published benchmarks removed one to two percent of their own items after review.
And the eval has to keep moving.
A private test split and a public development split with canary strings.
A live track that creates new items from release calendars within hours of each publication and queries every system at one day, seven days and thirty days, so freshness is a curve rather than a claim.
Quarterly versions with a frozen private split and a public changelog.
Retirement of items every system gets right, and nightly revalidation of “latest” items.
A published retraction log.
The scale at launch, for a domain of this kind, is on the order of a thousand single-answer items plus a few dozen tables, briefs and sessions, which is roughly 2,000 prompts per system per run, and that is what makes a three-point difference detectable.
Same answer across paraphrases, runs, with and without the date
Consistency rate; run-to-run agreement; date-hidden gap
Code
Efficiency
What does a correct answer cost?
Latency p50 and p95; cost per correct answer; tool calls
Code
Table 2. Sixteen dimensions of an enterprise research-agent eval, and how each is graded. All but one can be scored by code once the gold answer carries unit, period, vintage, source and a snapshot; the model judge is reserved for synthesis.
Why the eval deserves more time than the agent
Look at where the hours went.
ResearchRubrics spent over 2,800 hours of expert labour on 101 prompts.
Mind2Web 2 spent at least 1,000 on 130 tasks and their judges.
BrowseComp-Plus spent over 400 annotator hours verifying evidence for 830 questions.
DeepResearch Bench’s human agreement study alone took 225 person-hours for 200 reports.
DRACO’s 26 experts spent 45 to 60 minutes on each first draft, and nearly half the drafts went back.
None of that time built an agent. All of it built the thing the agents are measured by, and in each case the measurement changed a conclusion: which system is best, whether depth helps, whether a citation means anything.
Figure 8. Where the hours went. Every benchmark that changed a conclusion about research agents was built with hundreds to thousands of hours of expert labour, none of it spent on an agent. The judge-agent paper that started the trend measured its own human panel at 86.5 hours against two hours for the automated judge.
The first reason to invest is that in the labs the eval is literally the reward.
Search-R1 trains on exact match against the gold answer and nothing else.
WebDancer and WebSailor use a reward that is one-tenth format and nine-tenths a binary model judgment of the final answer.
Tongyi DeepResearch uses “a pure 0 or 1 signal of answer correctness”.
Kimi-Researcher adds a decay that favours shorter correct trajectories.
Their data engines exist to manufacture questions with verifiable answers, by obfuscating facts, injecting and fuzzing details, and filtering out anything a model can already answer, because without a verifiable answer there is no gradient.
Whatever is scoreable at rollout time is what the policy learns, which is why short-answer benchmarks are saturating and claim support is not. Measure the final string and you get an agent that finds needles and cites loosely. Measure supported claims and you get one that claims less and cites exactly. Measure a blended score and you get whichever trade-off the weights favour, without being told.
The second reason is the cost asymmetry. The eval is written once and run on every change to the model, the prompt, the retriever, the index granularity, the tool budget and the orchestrator, for the life of the product. Anthropic’s engineers describe the early phase as one where “a prompt tweak might boost success rates from 30% to 80%”, which is only visible if the twenty real queries are already there.
And the labs themselves evaluate at a smaller scale than their launch tables suggest: about 20 queries to start, “hundreds of outputs” through a judge, a relative 90.2 percent on an internal eval; Google’s 2025 claim was a two-to-one rater preference with no rater count; the vendor benchmarks of 2026 are 100 tasks each. The enterprise that builds a thousand-item, snapshot-based, scorecard bench on its own traffic will have a better instrument than most of its suppliers.
The third reason is that a badly designed eval is worse than none, because it is trusted.
A live-web eval drifts, and the drift looks like progress or regression.
A partial-credit judge adds twenty points of noise.
A rubric expanded by a model loses fifteen to twenty points of validity.
A judge the agent can see becomes the thing the agent learns, and the score keeps rising after the quality has started to fall.
A missing liveness check turns fabricated URLs into a 100 percent link-validity score.
A single run on a hundred tasks cannot tell a two-point improvement from chance.
My working rule is that the team should spend as long designing and calibrating the eval as building the first version of the agent, and that the eval should exist before the agent does. It should be built from real requests by the people who do the work today, and the first thing it should be run on is their own briefs, so you learn whether the rubric can tell a good brief from a bad one before you ask it to tell an agent from a human. DRACO’s saturation test is the model: if the current system already passes a task, the task is not finished.
A worked example: a research bench for one task class
Suppose a group with many operating companies wants an agent that writes supplier due-diligence briefs: ownership, sanctions and litigation exposure, financial signals, recent news, with sources, over internal records and the web. Each design choice below is borrowed from a paper above.
Tasks.
Sample 150 real requests from the analysts who do this work, weighted towards the ones they marked as unsatisfactory, as DRACO did with thumbs-down queries, and have a model strip personal data before any human sees them.
Two analysts write the brief they would accept for each, keeping the list of pages and records they used.
Build the single-answer tracks the dimension list demands, about a thousand items in all: ownership and registration facts; filing dates and effective dates; the latest filed accounts against superseded ones, with the superseded values stored as near-miss gold; values to be read from a given filing; small tables to be compiled across several filings; computed ratios with the working; rankings across suppliers.
Add 60 false premises and unreleased filings paired with answerable controls, 60 mutated claims to be fact-checked, 30 sandboxed items with planted instructions in a document, and 25 multi-turn sessions.
Give ten percent of items three paraphrases, ask every recency item with and without the date, and tag every item with every complexity it carries.
Rubric.
Twenty to forty criteria per brief, written by analysts and never expanded by a model, each with one concrete example, each binary, each marked mandatory or optional.
At least three negative criteria per brief: things it must not assert, with penalties scaled to stakes as DRACO does for medicine.
Every attribution criterion critical, as Mind2Web 2 does, so an unsupported claim zeroes its branch.
Run the rubric on the analysts’ own briefs and on last year’s. If the current product or a plain model with search already passes a task above 90 percent, send the task back.
Corpus.
Snapshot everything the analysts used plus the internal records, and mine negatives by running the agent’s own sub-queries through search and keeping what comes back, roughly 76 per query. Store each page as fetched text with a hash and a retrieval date.
Index at passage granularity and test the retriever alone first, as tier one: Recall@5, Recall@100 and nDCG@10 on the labelled passages, with BM25 on passages as the baseline the dense model has to beat, and a context-precision check on what the generator is actually shown.
Test the web search layer as tier two: the same model, a fixed query set, and each search provider swapped in, scored on evidence recall and cost per thousand queries.
Keep a parsing test with ground truth for the scanned PDFs. For the live-web component the product will use in production, serve it through a frozen archive and re-run live once a month to measure the drift.
Scores. A scorecard, never one number. The four headline scores:
Evidence recall: the share of the analysts’ pages the agent retrieved at any point in its run.
Answer accuracy on the single-answer tracks, graded by code after normalisation, with each wrong answer labelled by which near-miss gold it matched (stale, wrong entity, wrong period, wrong unit).
Trustworthy coverage: each sentence and citation paired deterministically; liveness checked first so a fabricated reference is recorded as fabricated and a dead archived one as stale; the snapshot fetched; a binary judge deciding support; the support rate multiplied by citation recall.
Deflection: true positives on the nothing-here and not-permitted slices, false positives on the paired controls.
Beneath them, every dimension in Table 2 broken out by track, by complexity tag and by the number of stacked tags, plus the three trace checks per step, forgetting, hallucination and repeated calls, and latency and cost per correct brief. Run the same agent closed-book, with the gold document given, and open-corpus, and report the three gaps.
Gold and judge.
Build the answer key the way Figure 7 describes: three blind extractions from different model families, deterministic checks that the quote is in the snapshot, adversarial verifiers for revisions and alternative readings, consensus, then an analyst’s sign-off with their overturn rate published; plant five percent known-bad answers and require the pipeline to catch them.
Before trusting the support judge, have analysts label 300 of its verdicts, report a kappa rather than raw agreement, swap the position of the candidates to check for position bias, and re-sample whenever the judge model or the rubric changes.
Give the judge an “Unknown” option. Use a different model family from the agent, hold out the judge prompt from anyone tuning the agent, and publish the share of items graded by code.
Runs.
Evaluate at the tool-call budget you intend to ship and at three times that, and plot support against depth.
Run each task at least eight times, report paired differences against the previous release with standard errors, and report pass^3 for the mandatory criteria as the number the analysts see.
If support falls as the budget rises, the fix is in the orchestrator, where Hirsch found 84.7 percent of the errors, not in the retriever.
What to do
Build the eval first, from real requests, with the people who do the work, and budget as many hours for it as for the first agent. The published benchmarks cost 400 to 2,800 hours each, and each one changed a conclusion.
Report evidence recall, answer accuracy, trustworthy coverage and deflection separately. They measure different components and move independently; Gemini’s 111 supported citations at 81 percent and Perplexity’s 31 at 90 percent are not the same product, and a support rate alone rewards saying less.
Freeze the corpus and score the retriever alone, at passage granularity. The same model moved from 14.6 to 93.5 percent with retrieval changes only; BM25 over passages beat an eight-billion-parameter embedder; live fetching turned an 81 percent citation score into 57 and then into no score at all.
Grade claims, not reports, with binary checks and the evidence in front of the judge, and check the link exists first. Judges reach 96 to 99 percent on that and near chance on holistic grades of long reports. Between 3 and 13 percent of cited URLs were fabricated, and a liveness tool drove that under 1 percent.
Write rubrics by hand, with examples, mandatory and optional flags, and negative criteria; never let a model expand them. Examples add three to four points of validity; model expansion removes fifteen to twenty; presence-only criteria are what reward hacking feeds on.
Treat depth as a dial you evaluate, not a feature you ship. Support fell from 79 to 17 percent as tool calls rose from 2 to 150; agents collapse within sixteen dependent steps; wrong attempts search more than right ones.
Grade by code wherever the answer is a number, a date, a category, a list or a verdict, and make the gold bitemporal. Store unit, period, vintage, source, snapshot and every superseded value with each item, label wrong answers by the near-miss they matched, and keep the model judge for synthesis alone.
Verify the answer key as hard as the agent. Blind multi-family extraction, deterministic checks, adversarial verifiers, planted errors and a published overturn rate; the launch benchmarks removed one to two percent of their own items after review.
Size the eval statistically. About a thousand items for a three-point effect, paired differences, eight or more runs per task, pass^k for consistency, and error bars on every leaderboard you publish internally.
Use the verifier inside the product, and keep a human for what it cannot see. BrowseComp’s best-of-N gain exists because verifying is cheaper than finding; a URL checker as a tool cut bad citations to under 1 percent; source quality and content farms were found by testers, not graders. Sample ten briefs a week for an analyst to read, and feed what they find back into the rubric.
The finding problem took fifteen months to go from 51.5 percent to 90.4. The supporting problem is at 47.7 percent for a model that resolves every link it cites, and it gets worse the harder the agent works. An enterprise research agent will be judged by the people who read its output, who will check one claim, find the page does not say it, and stop trusting the rest. The eval that catches that is the product specification. Write it first, and spend the time.
Weekly newsletter
The Control Plane, on LinkedIn: one problem from running AI in production each week, explained in plain terms. Or follow by RSS.
Ashish KumarHead of Platforms, AI & Data at Tata Group. Previously applied AI at Ola Krutrim, data science at Salesken, and conversational AI at Reliance Jio Haptik and Active.Ai. Full biography · LinkedIn